
Alternate names: D. Debnath, D Debnath, Debnath D., Debnath Dwaipayan
I am a PhD student in the EQUATION group of Prof. Jon Sundqvist at the Institute of Astronomy (KU Leuven). My work combines cutting‑edge 2D/3D radiation‑hydrodynamic simulations using MPI-AMRVAC in a unified approach, starting deep within the sub‑sonic regions and extending all the way upto the line‑driven wind region in hot and luminous, massive stars.
Our new unified atmosphere‑and‑wind models are the first to self‑consistently bridge the photosphere and supersonic outflow. They reveal that:
I also co‑develop LIME — an on‑the‑fly mass‑loss estimator that couples modified CAK theory with line‑statistics parameters to predict mass‑loss rates for stars of arbitrary chemical composition.
When I’m not simulating stellar winds, I cultivate an ever-expanding collection of tropical plants—see the full greenhouse on the plants page.
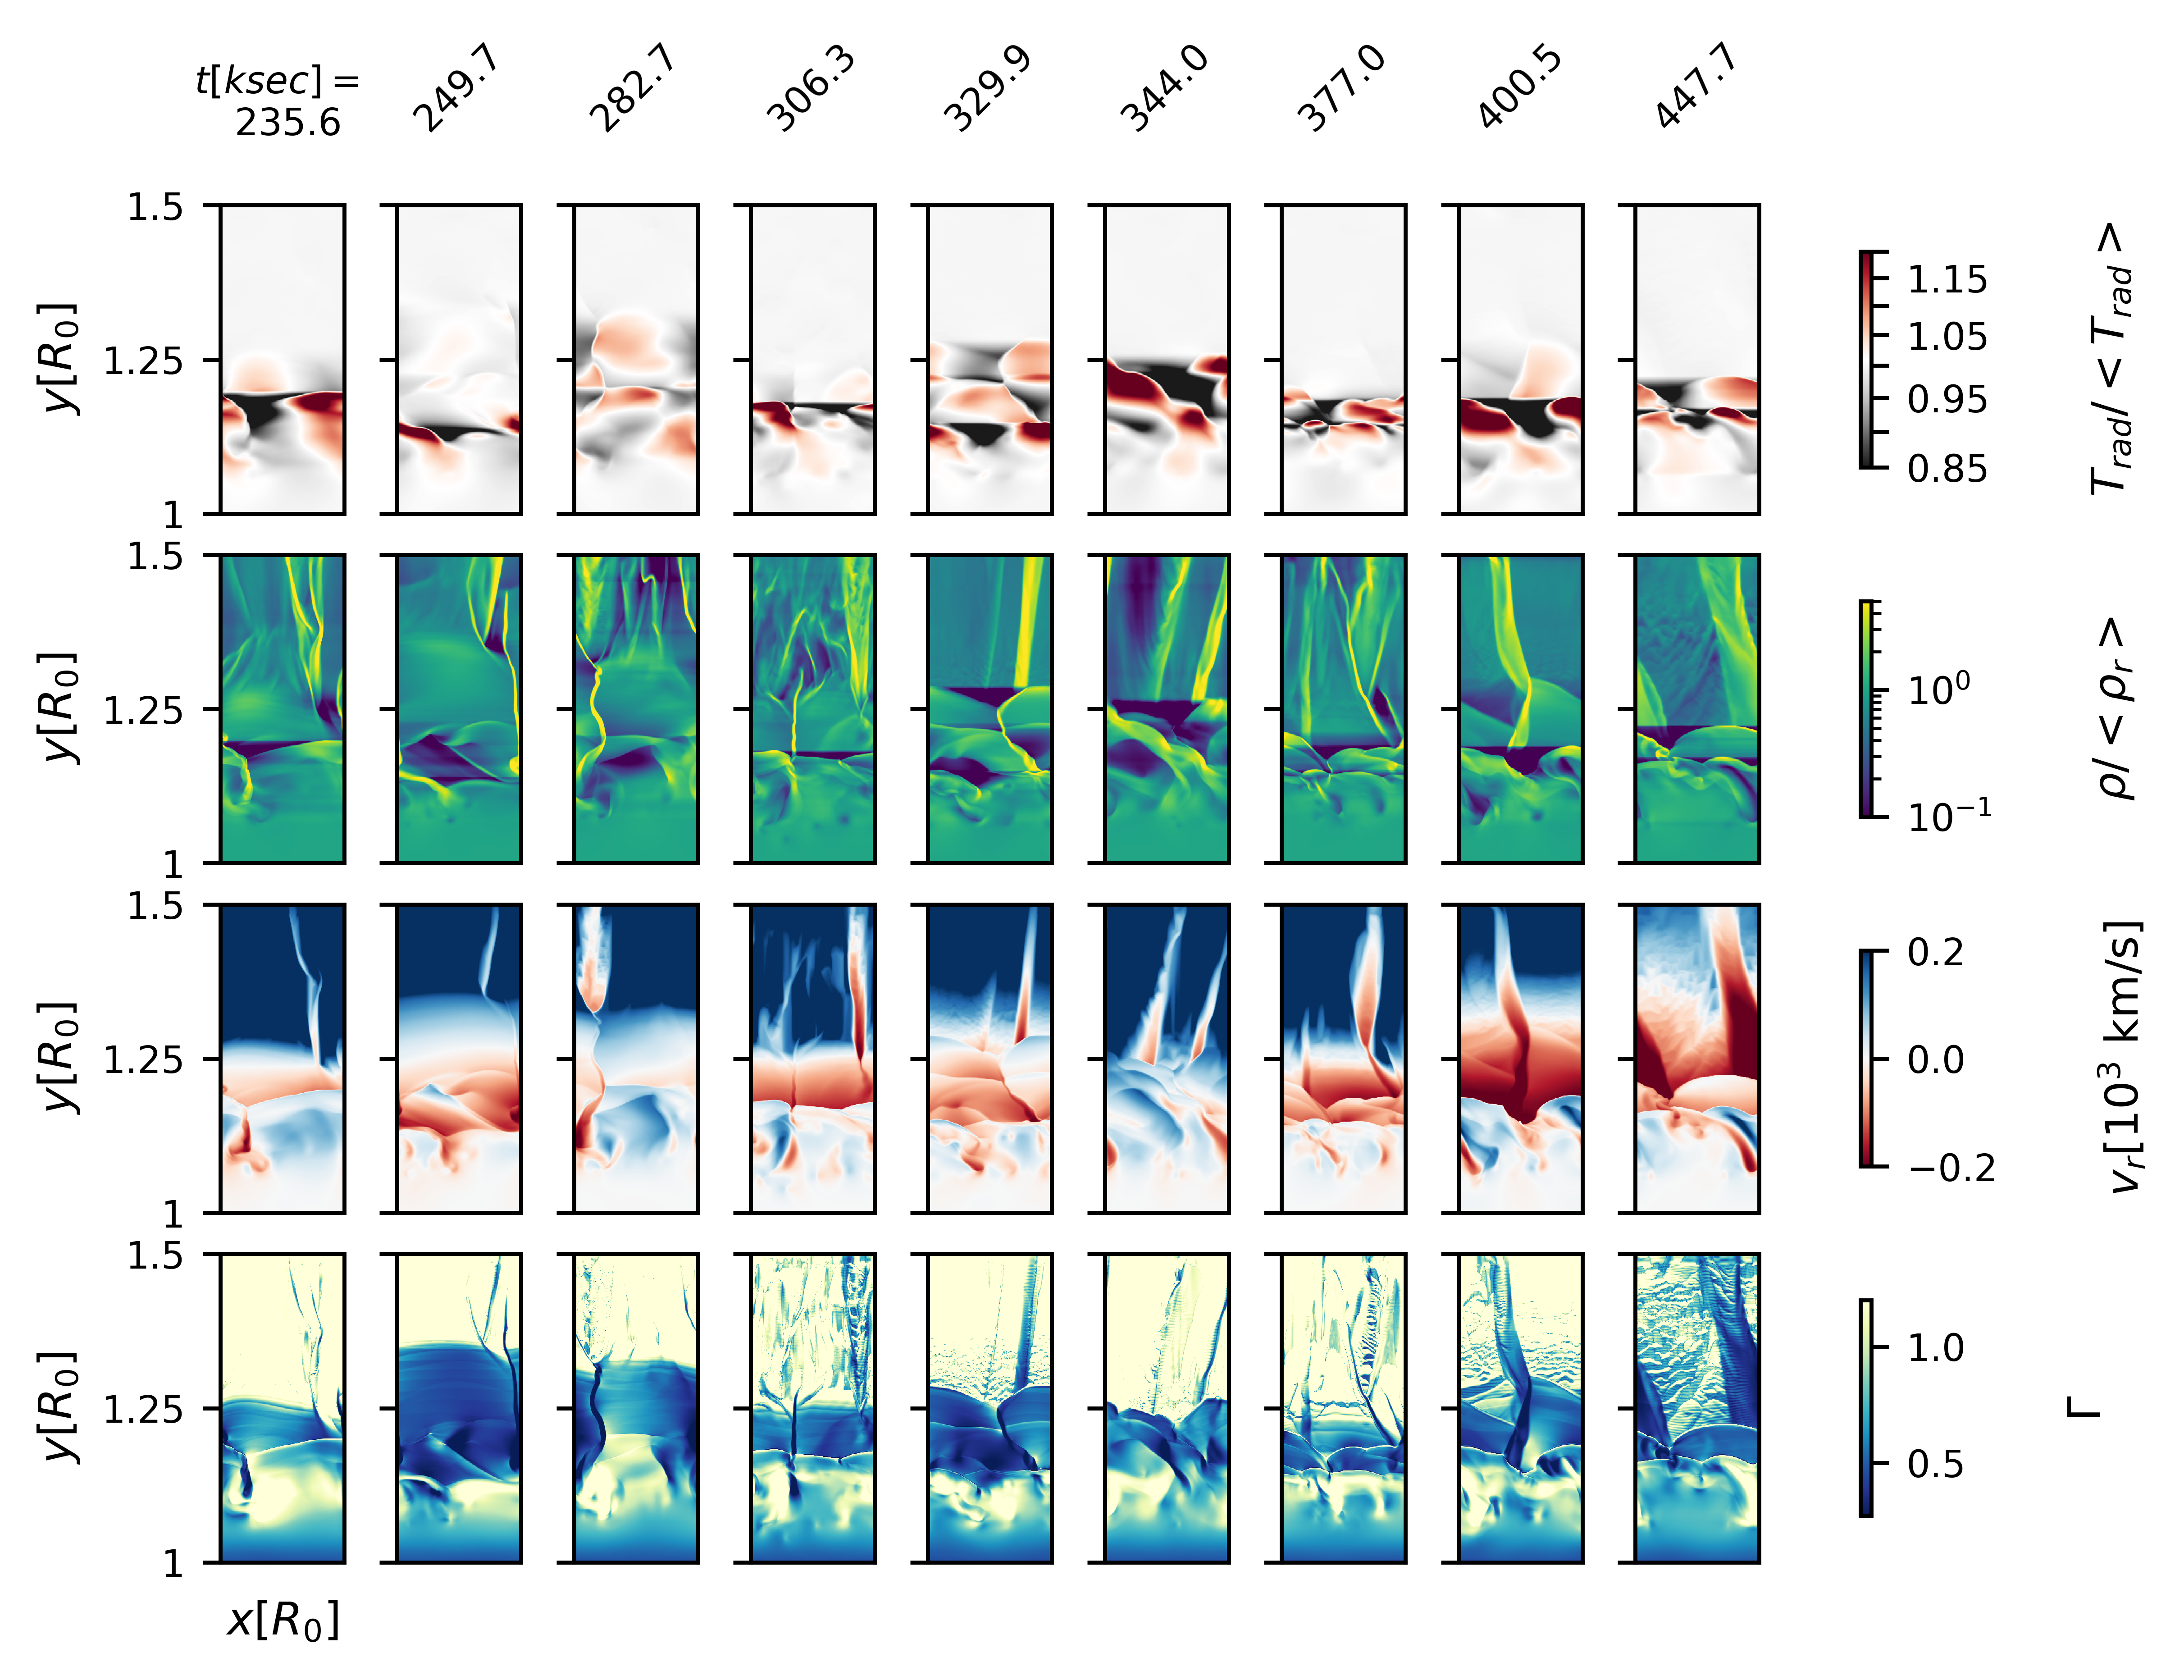
The figure shows the temporal evolution of our prototypical 'O4' simulation (2D) during the dynamically relaxed phase. It shows how the Γ < 1 sub-Eddington layers close to the lower boundary have become quasi-stable, characterized by low variation in temperature and velocity; the radial velocity dispersion is here about ∼ 1 km/s and the temperature dispersion is ∼ 1.5%. As the temperature then decreases outwards from about 450 kK at the lower boundary, the opacity increases and creates local super-Eddington regions (below the photosphere) with Γ > 1.
The net result is a highly structured and turbulent sub-surface atmosphere characterized by temperature fluctuations, strong density contrasts, and large turbulent velocities that 'overshoot' into the overlying cooler surface layers with lower opacities. The turbulent gas stemming from the deeper atmosphere naturally interacts with the line-driven layers around and above the photosphere. This complex interplay creates a situation wherein the line-driven wind acts like a suction mechanism, preventing some gas parcels that otherwise would have turned over from falling back into the deeper stellar envelope. Simultaneously, the turbulence arising from the deeper atmosphere introduces a natural variation in flux and line-opacity in the wind launching region.
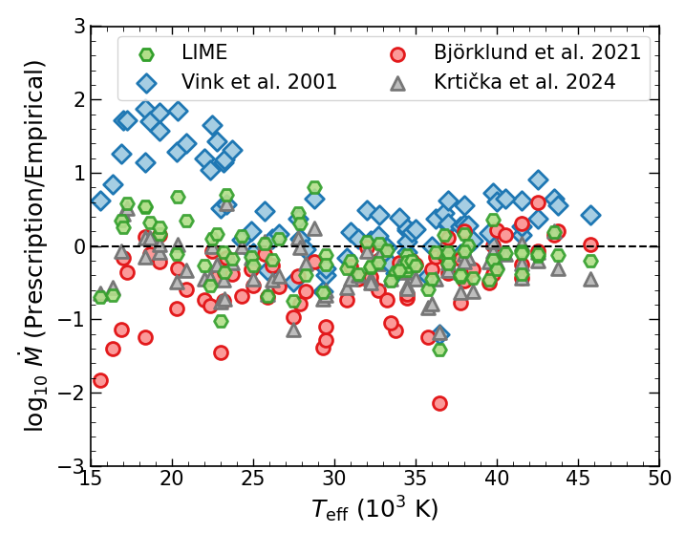
Figure compares LIME predictions to mass-loss rates derived from observations of 84 OB-stars in the Milky way, LMC, and SMC. These empirical rates are derived in a homogeneous way: optical and ultraviolet observations of a multitude of strategic spectral lines are fitted to synthetic spectra calculated by means of the model atmosphere and wind code fastwind (Puls et al. 2005; Sundqvist & Puls 2018), accounting for effects of wind clumping with arbitrary optical thickness, a non-void medium in between clumps, and for porosity effects in velocity space. Observational data come from the ulysses and XshootU projects (Vink et al. 2023) and a genetic algorithm approach is used for each star to find a global best fit to the data (Brands et al. 2022).
It shows an overall good agreement between our predicted rates and those empirically inferred from observations. When making the same comparisons also to the alternative mass-loss rate recipes from Vink et al. (2001); Björklund et al. (2023); Krtička et al. (2024), as displayed, the simple method presented here performs as good or even better.
Visit LIME website